BASIC INFORMATION
The purpose of the internal combustion engine is the production of Torque Torque by converting the thermal energy of combustion of Fuel Fuel into the mechanical rotational force of the internal combustion engine crankshaft.
The operating efficiency (COP) of a Torque production engine is:
– time spent on the production of Torque;
– Torque value at the moment of time;
– the amount of Fuel spent on the production of Torque at a point in time,
or,
Getting More Torque in Less Time and Less Fuel Costs.
A statement about the objective nature of what
dynamic shift in favor of increasing Torque
without increasing Fuel Consumption and
increasing Motive Force without increasing Fuel Consumption Fuel is a direct physical consequence of reducing the force load on the crankshaft,
requires
objective and visual confirmation,
which the dyno computer can provide by comparing the Torque and Motive Force parameters Before and After Installing/connecting the Super Torque Impulse Module.
Detailed analysis with explanations
A separate graph presented below is a Description of the processes of changing the dynamic parameters of the internal combustion engine, which are caused by the inclusion of the “Super Torque” Pulse Module in the operation of the vehicle’s fuel-power system.
Why do they take measurements on a dyno?
The dynamometer determines the current actual operational state and performance of the internal combustion engine;
carries out computer recording of the main operating parameters of the internal combustion engine – Torque, Torque, in NM; Motive Force, in N;
the resulting ICE performance/Power, Power, in HP in dynamics, with fixation of Speed, Speed, in KRN, and engine speed.
It is important to emphasize: Power and Speed are derived, or resultant, performance parameters of Torque over a certain time and a certain amount of fuel.
How to measure on a dynamometer stand.
The car is fixed on the stand’s rollers, from which the force generated by rotating the wheels is removed.
The force force is removed from the rollers three times; the resulting result is the arithmetic mean of three measurements taken one after another, which reduces the error of the obtained internal combustion engine parameters for constructing one accurate graph.
General data is entered into the graph above; At the bottom of the graph the obtained values of Torque at a certain Speed, Power at a certain Speed and Motive Force at a certain Speed are entered.
What is the difference between comparative measurement and regular measurement?
This measurement is carried out to computer record and compare the main operating parameters of the internal combustion engine and confirm the Dynamic Efficiency of the “Super Torque” Pulse Module;
measurement and fixation is carried out twice with the minimum possible time difference:
without installed “Super Torque” Pulse Module
and, immediately after the first dynamic measurement,
with the “Super Torque” Pulse Module installed.
Should be considered
Features of FPDtech.
Fast connection.
Connecting the “Super Torque” Pulse Module with pre-installed, in the case of measurement, commutation takes time to open the hood and snap the commutation onto the Module body to connect to the power supply.
Fast response.
The main feature of comparative dynamic measurement is the rapid response of the internal combustion engine to the operation of the Pulse Module:
Only this feature can make it possible to immediately plot two DIFFERENT Curves on a comparative dynamic measurement graph, with different values, with a minimal time difference between the two measurements.
Visibility and Objectivity.
Fast connection and quick response of the internal combustion engine together reduce to a minimum the potential external influence, which makes reducing the force load on the internal combustion engine crankshaft the only effective factor causing, in the shortest period of time, a change in the operating parameters of the internal combustion engine and allows, in the shortest period of time, to identify the Fuel and Dynamic Efficiency of the Module and emphasize the objective, that is, the degree of impact of the Module measured quantitatively and recorded by the dynamometer computer.
Prerequisites for taking measurements:
comparative measurements in the graph presented below were carried out on a car that had not undergone preliminary diagnostics of malfunctions and system errors; without completing a sufficient adaptation distance (more than 400 km) after installing the “Super Torque” Pulse Module.
Note:
Before comparative dynamic measurement, a Pulse Module was installed on this vehicle; the minimum adaptation mileage, at least 20 km, required to begin reconfiguring the load control system and fuel dosage management has been completed; Before carrying out the comparative dynamic measurement, the Pulse Module was turned off, the vehicle was driven for at least 15 km to reconfigure the load control system and fuel dosage control
in order to return to the initial, before installation of the Module, values of VTS dosages.
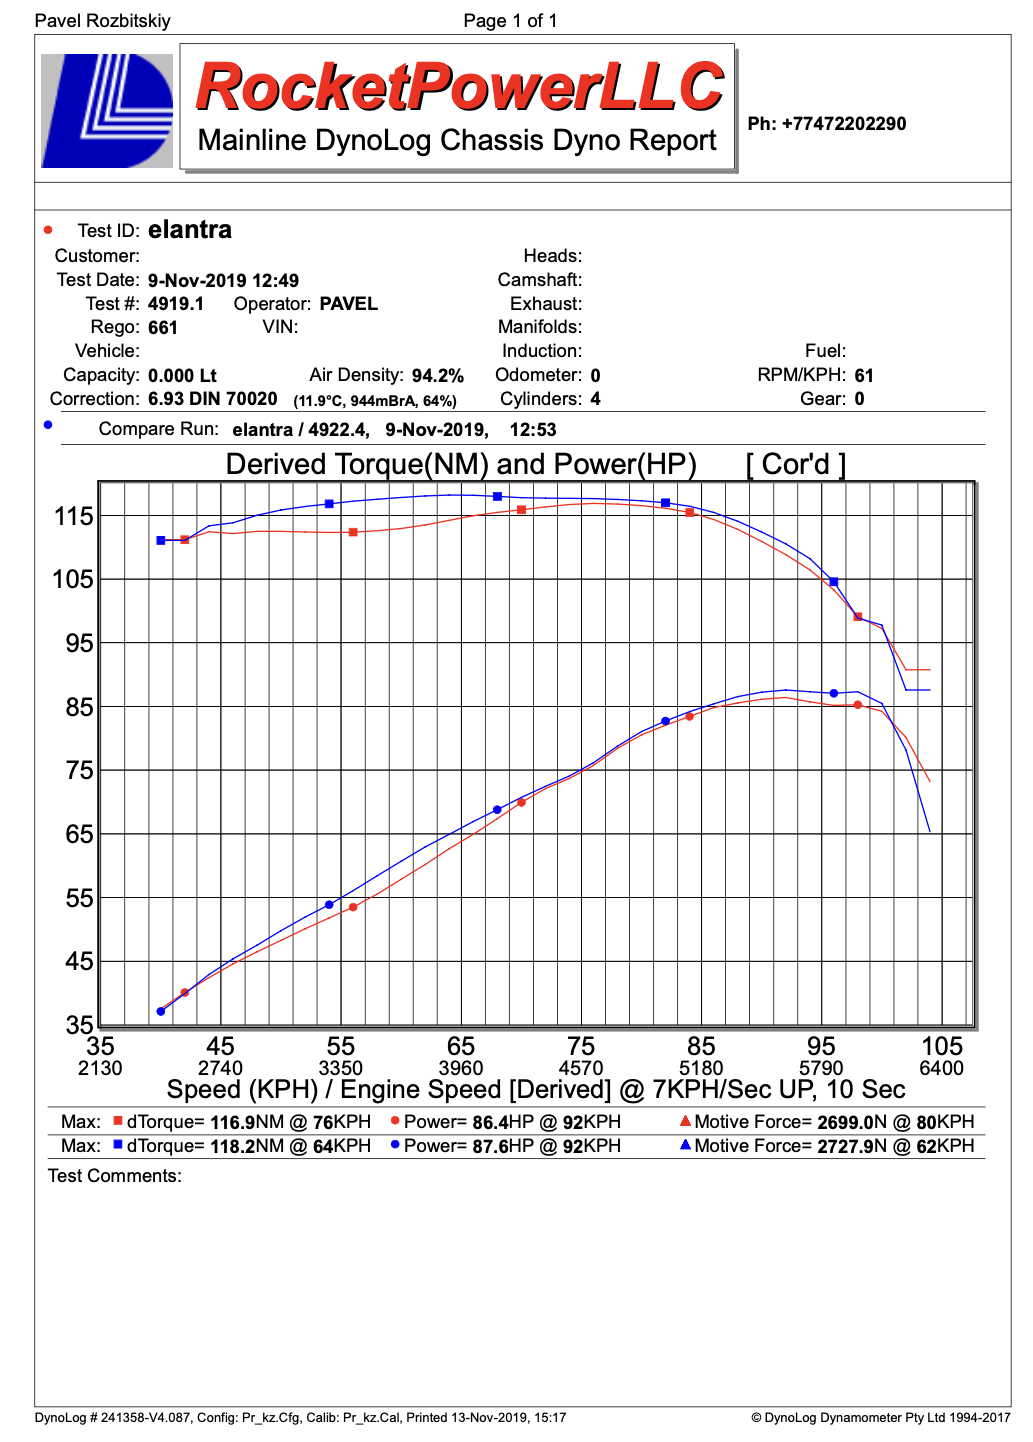
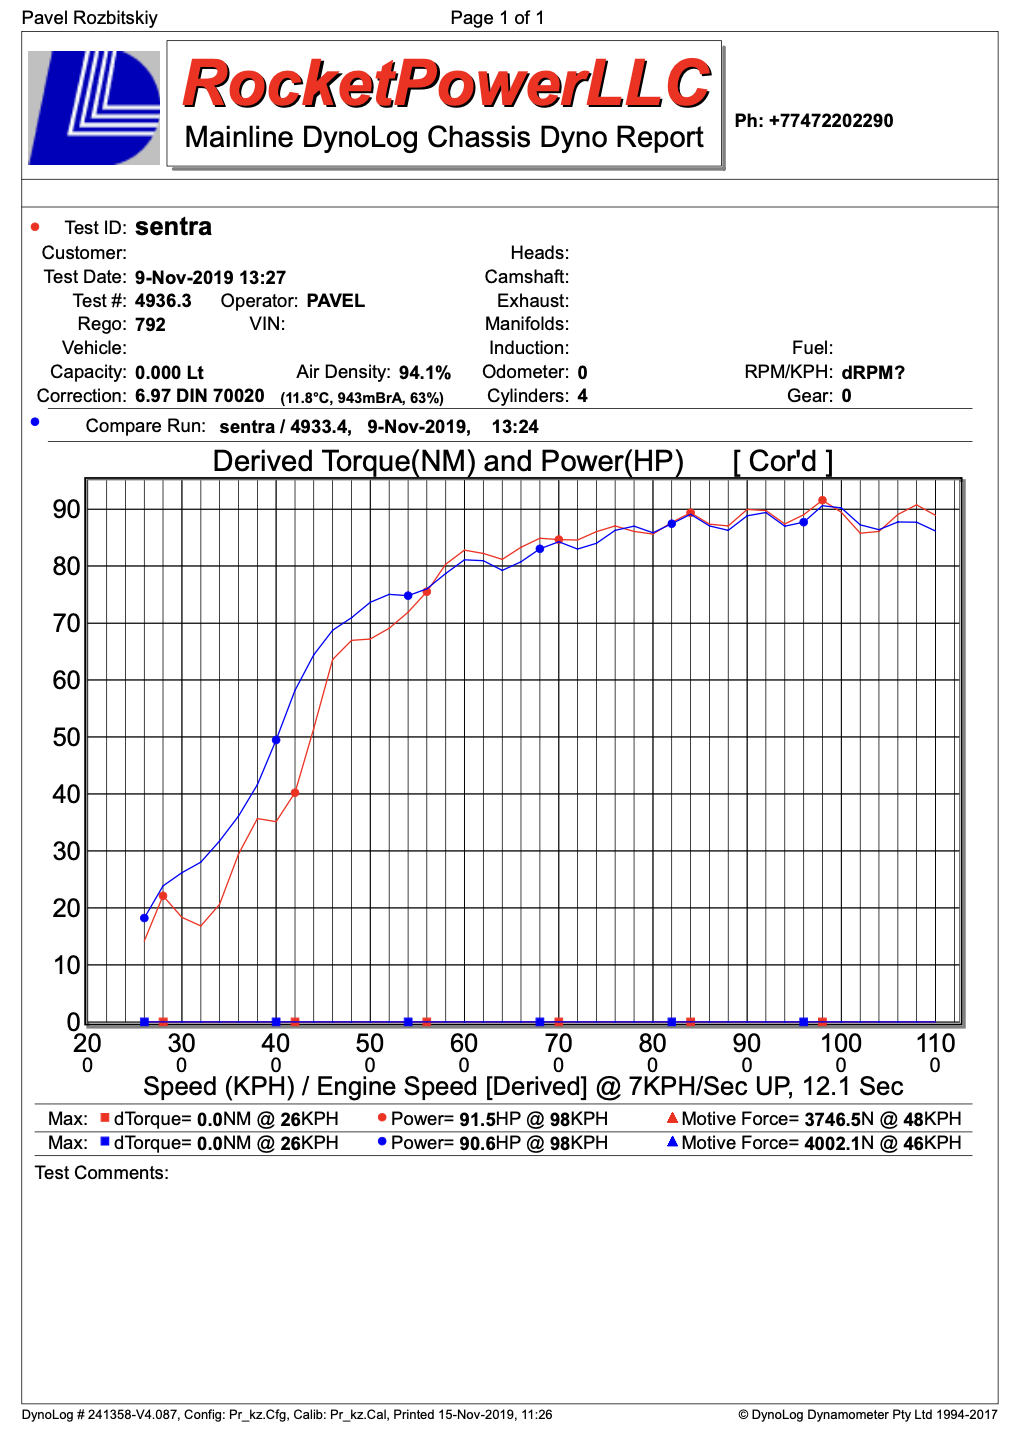
Chart description:
the two Curves at the top of the graph, marked with squares, show two values of Torque, Torque, where the red Curve is the Torque of the given internal combustion engine without the installed Pulse Module; The blue Curve is the Torque of a given internal combustion engine with the “Super Torque” Pulse Module installed immediately after the first dynamic measurement.
It is proposed, for the sake of brevity of the Description, to designate the red Curve as “Curve Without”; blue Curve “Curve C”.
Graph1.pdf
To measure the quantitative difference between “Curve Without” and “Curve With”, a Common Denominator, or General Parameter of ICE operation, is required:
for comparative measurements, this is the “Number of Revolutions” of the engine at which the same Torque value is achieved.
Result:
On the “Curve Without” graph, the Torque value of 115 NM was obtained at an engine speed of 4021;
on the “Curve C” graph, a Torque value of 115 NM was obtained at an engine speed of 2923.
The resulting difference in Torque performance of 115 NM is 1098 engine revolutions and clearly shows the Increase in Engine Efficiency on the “Curve C” graph with the “Super Torque” Pulse Module connected.
Fuel Efficiency Verification
Pulse Module “Super Torque”
dynamometer computer.
The recorded difference in revolutions makes it possible to calculate the difference in VTS (Air-Fuel Mixture) injections, or the quantitative difference in Fuel consumption, which for a 4-cylinder internal combustion engine is 1098/2 = 549 VTS injections. Thus, objectively, through computer recording, confirmation of the Fuel Efficiency of the Pulse Module was obtained, along with the Dynamic one, namely, it was established that to obtain a Torque value of 115 NM with the connected “Super Torque” Pulse Module, 549 fewer VTS Fuel injections are required , on a given vehicle in a given operating mode of that vehicle.
The schedule must include:
Maximum recorded Torque value on the “Curve Without”:
116.9 NM at a speed of 76 km/h;
Maximum recorded Torque value on “Curve C”:
118.2 NM at a speed of 64 km/h.
For vehicle movement
the only significant indicator is the “Driving Force”, Motive Force, in N: this is the force of repulsion of the Wheel from the road surface.
From the point of view of the car owner/driver, this is the most sought-after practical ability of a vehicle; from an engineering point of view, this is an indicator of the effectiveness of the internal combustion engine as a source of Motion Force.
This graph shows the following Motive Force values:
on “Curve Without” 2699 N at a Speed of 80 km/h;
on “Curve C” 2727.8 N at a Speed of 62 km/h, which means:
GREATER Motive Force produced in LESS time
with the “Super Torque” Pulse Module connected
clarification:
under the same operating mode of the internal combustion engine, “in less time” means “with lower fuel consumption Fuel”;
note:
The dyno computer will record Motive Force values at DIFFERENT SPEED in many cases.
Conclusion
about Dynamic and Fuel Efficiency of the Pulse Module
“Super Torque” is based on comparative dynamometer data that states the following:
a sustained INCREASE in Torque performance with LESS FUEL injections, which, throughout the graph, or in other cases, over most of the graph, is expressed in the leading and superior nature of the “C Curve”;
GREATER Maximum Torque value at LOWER or equal Speed;
GREATER Motive Force at LESS or equal Speed, and,
together,
sustainable INCREASE in internal combustion engine performance
according to the main parameters – Torque and Motive Force.
Note:
stability ensures the continuous operation of the “Super Torque” Pulse Module;
The operation of the Module begins after the engine starts and ends after the engine stops.
Note:
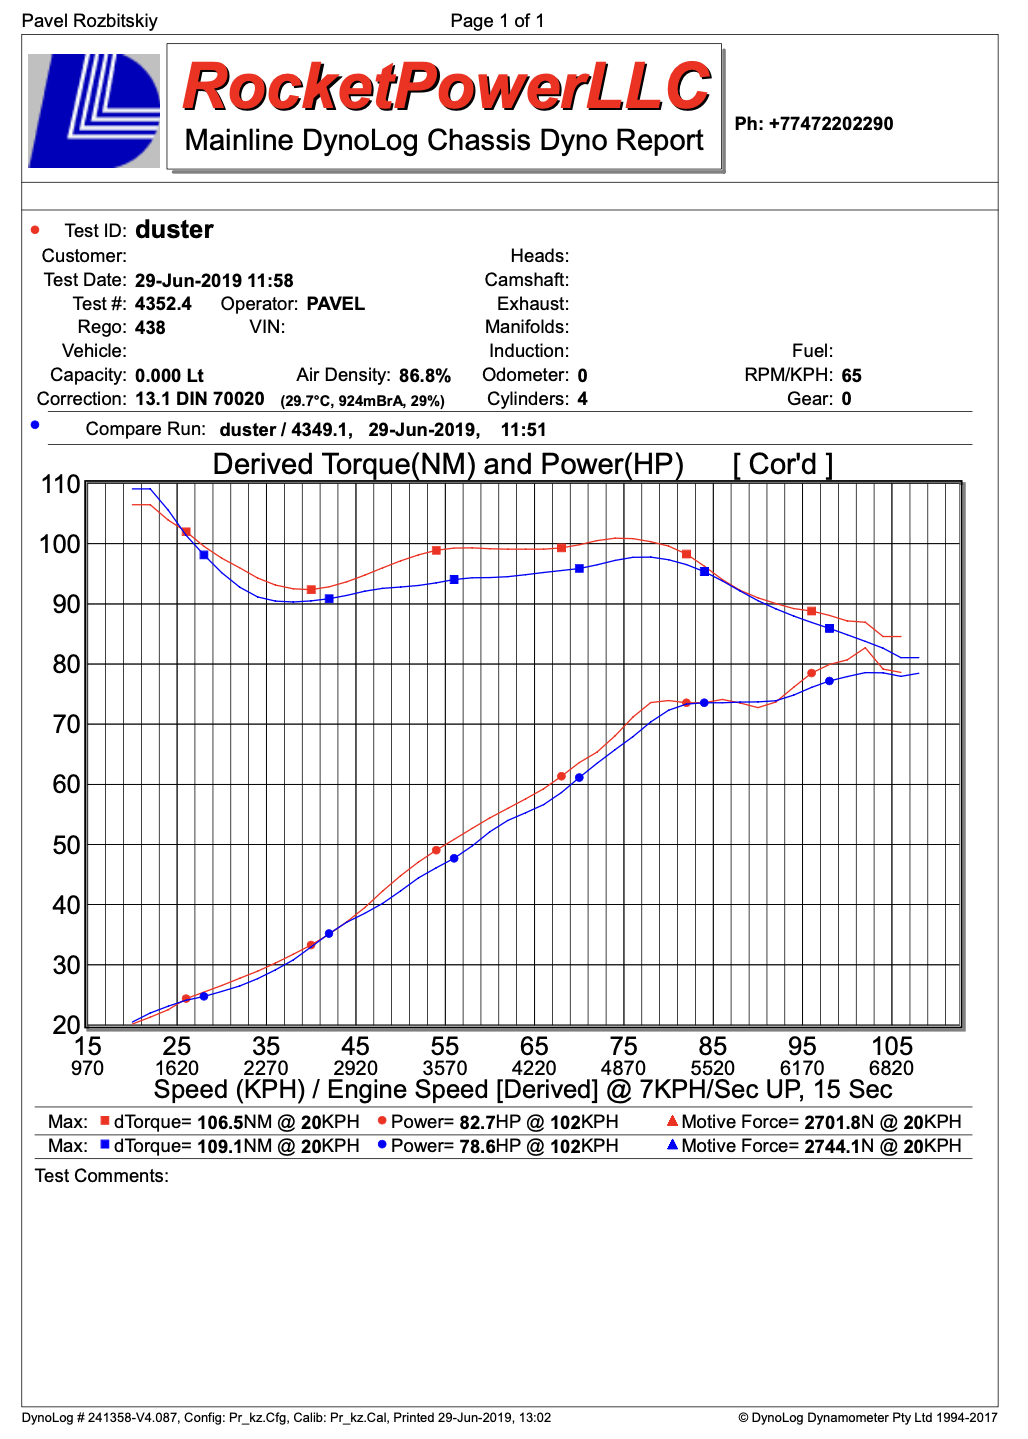
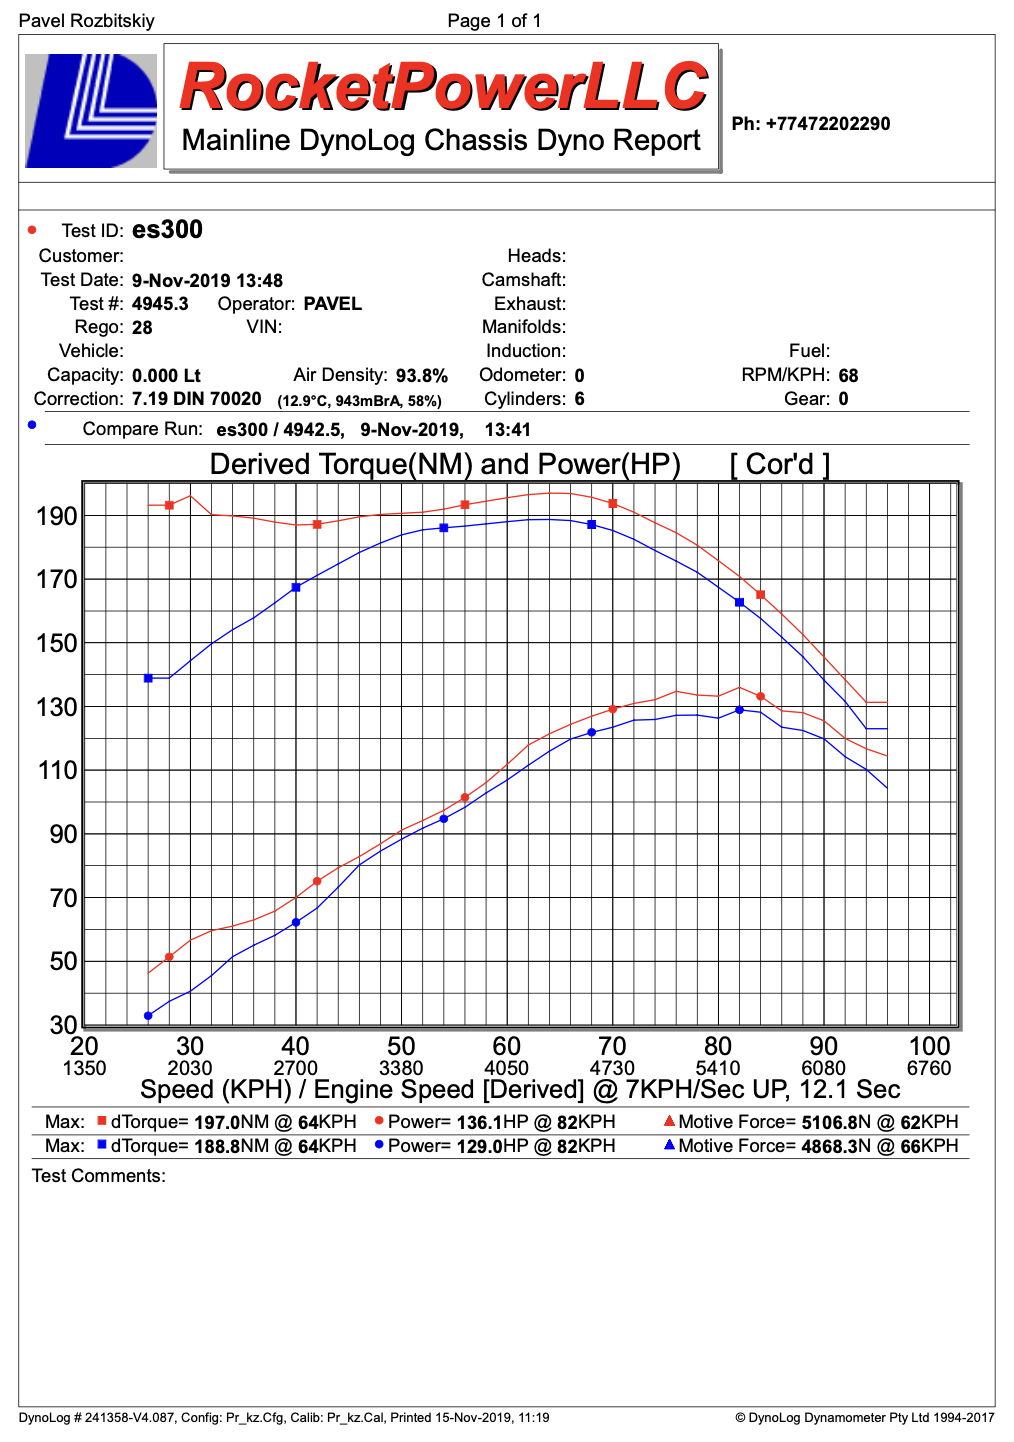
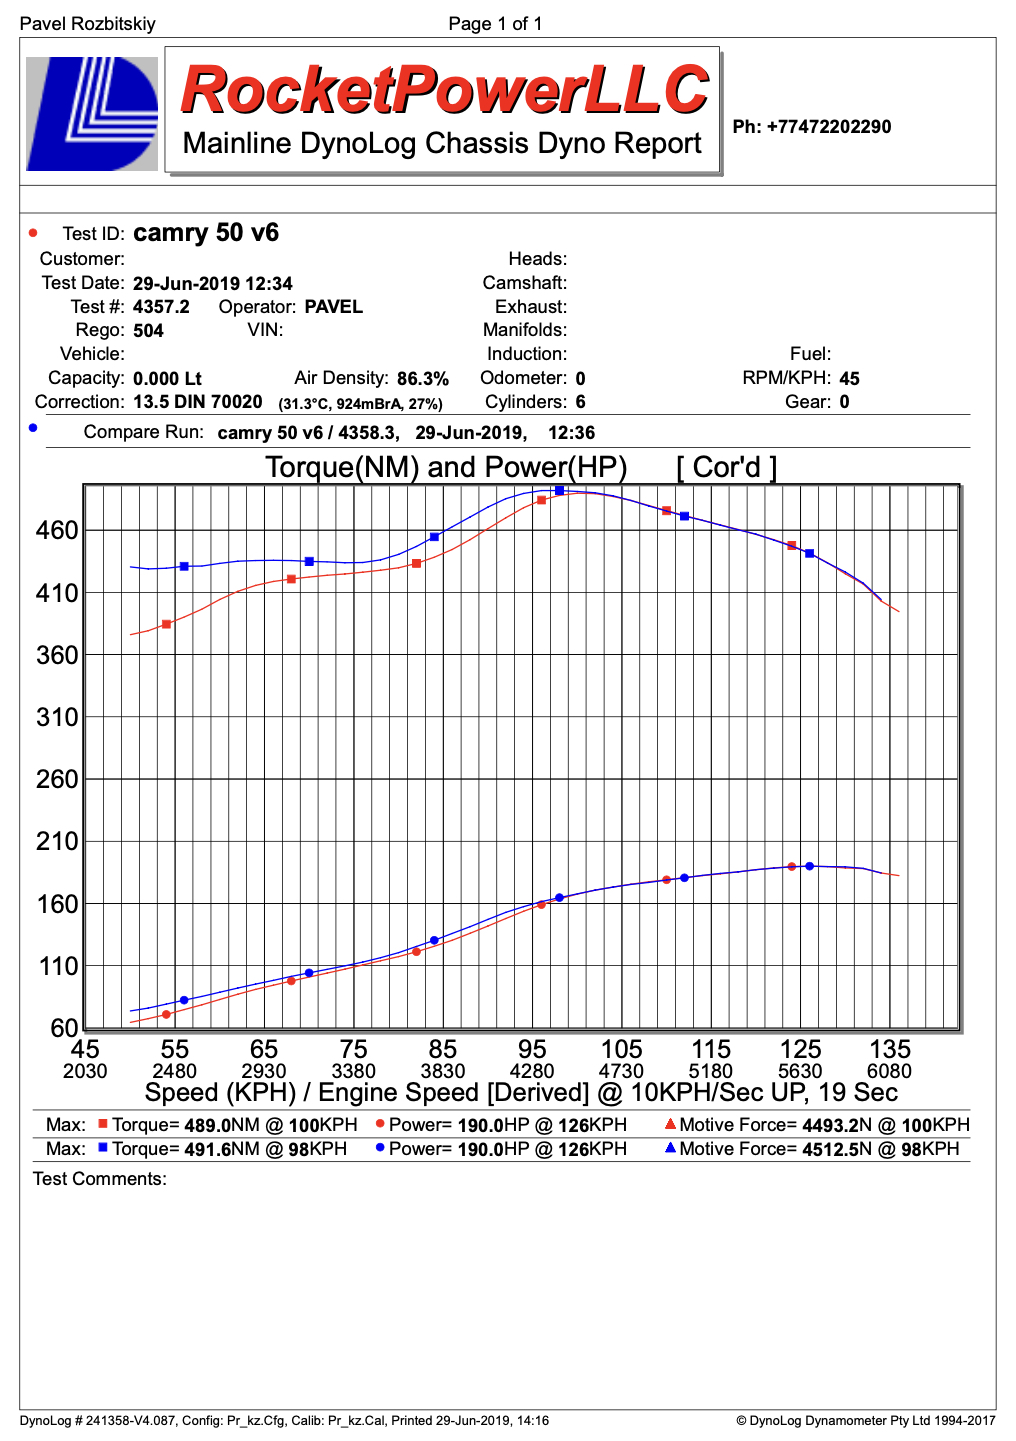
a more significant difference between the two Curves in favor of “Curve C” is shown by cars in better operating condition (see “All graphs of measurements on a dynamometer stand”).
It is important to note:
The main feature of any measurement on a dynamometer stand is that the measurement is always intensive in the operation of the internal combustion engine in order to more accurately record operating parameters.